


Pros and cons of intraday trading
How to enter and exit positions in intraday trading
Moving average crossover strategy

As the name suggests, intraday trading—also known as day trading—is a trading style where all positions are opened and closed within the same trading day. Rather than holding positions overnight or for several days, intraday traders aim to profit from short-term price movements within the span of a single day. This form of trading has a long history. It began in 1867 with the invention of ticker tape machines, which used telegraph wires and Morse code to transmit stock prices. Back then, all trading went through brokers, and the ticker tapes displayed real-time activity from the trading floors. A major shift came in 1971 with the introduction of Electronic Communications Networks (ECNs). These digital marketplaces allowed individuals to buy and sell stocks electronically, without needing to go through a traditional broker. ECNs made day trading more accessible and popular among retail traders. Today, ECNs are still widely used by online brokers and trading platforms to match buyers and sellers efficiently and give them access to day trading.What is intraday trading?
Depending on their capital, available time, and risk tolerance, traders can choose between swing trading and intraday trading: Choosing a strategy that suits you best is one of the key elements of starting trading. Intraday trading is more intense and fast-paced, requiring quick decision-making and constant monitoring of the markets.Intraday vs. swing trading
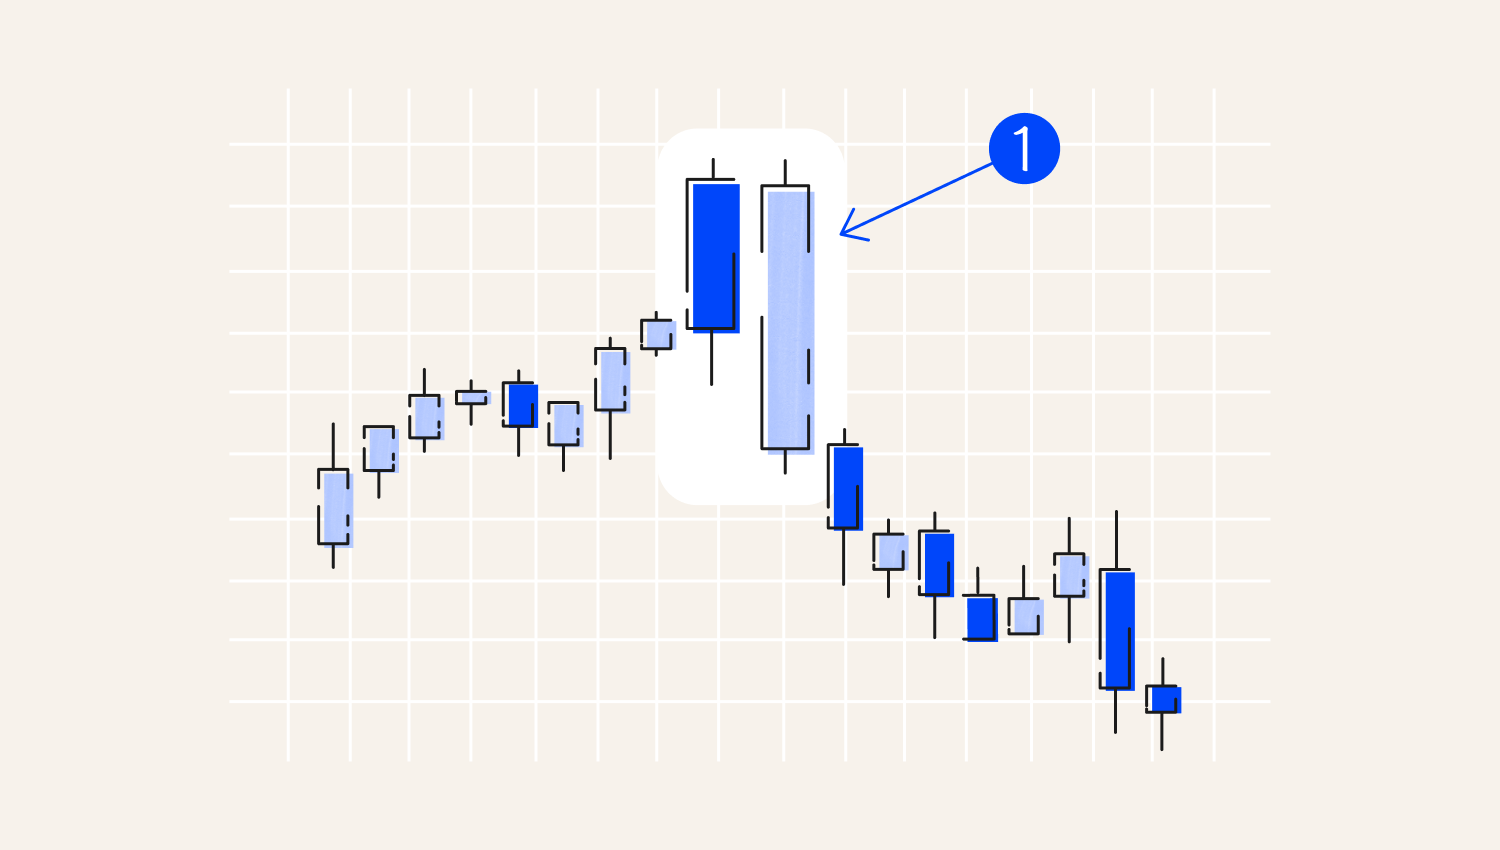
Intraday traders employ different approaches to maximise their profits. Let's examine some of the most popular intraday strategies. Trend trading is one of the most reliable and commonly used intraday trading strategies. The core idea is simple: identify the direction in which the market is moving—upward, downward, or sideways—and trade in alignment with that trend. To do this, traders first analyse the market to determine its overall direction. Once a trend is confirmed, they enter a position that follows it and aim to hold that position throughout the day, capitalising on the momentum. Various technical indicators help traders identify and confirm trends. Common tools include trendlines, moving averages, and momentum-based indicators like the Relative Strength Index (RSI) and other oscillators. In the example below, you'll notice vertical lines running from top to bottom—these are known as day tracers. They separate each trading day on the chart. The price movement between two vertical lines represents one full trading day, from the market's open to its close.Intraday trading strategies
1. Trend trading
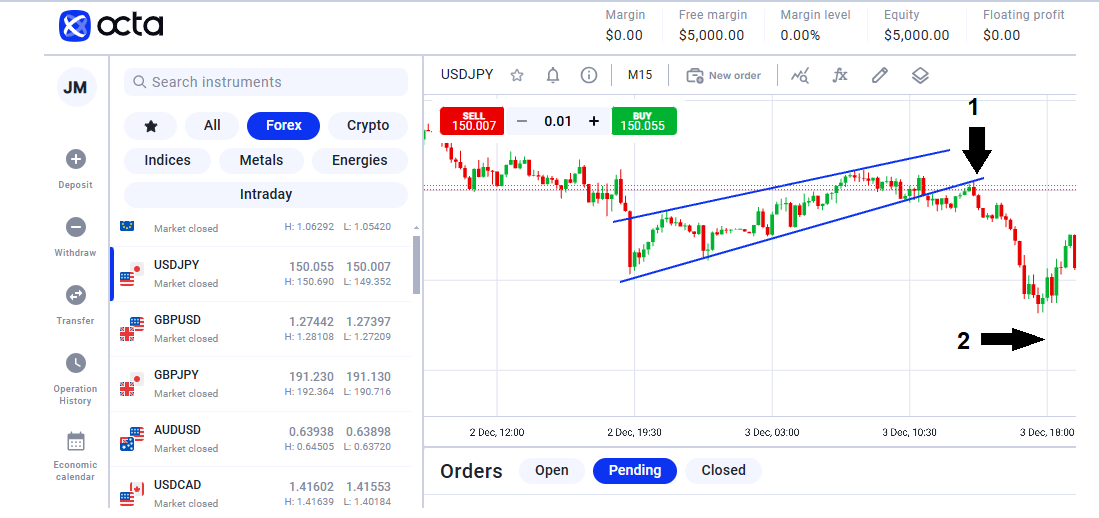
In the chart above, a break below the trend line, followed by a retest, signalled a potential sell entry at Point 1—a common setup for breakout traders. This confirmation allowed for a short position aligned with the newly forming downtrend. Since this was an intraday trade, the position was closed before the price reached the end-of-day marker at Point 2, as indicated by the vertical line. This ensured the trade was completed within the same trading session.
2. Scalping
Scalping is an intraday trading strategy deployed by both novice and experienced traders. The plan involves trying to take advantage of small price movements in minutes. In this case, traders open positions and let them run for minutes depending on the direction the price is moving.
Scalping is for active day traders who can monitor their trading screens to identify price differentiation. When the price of an asset moves up, traders enter a buy position and immediately shut it down when it starts moving down.
Buying, selling, and exiting positions come into play multiple times throughout the day. Scalping is an ideal intraday trading strategy for liquid markets that allows one to enter and exit the position with ease. Given the high risk of losses accruing in a volatile market, one should only deploy the strategy with a lot of caution.
3. News trading
News tends to trigger substantial price swings, which many professional traders exploit. The price of an asset usually moves depending on how traders interpret the outcome of various news events.
News events trigger high volatility, allowing intraday traders to enter long and short positions quickly. For this reason, economic calendars are essential as they give intraday traders a heads-up on potential market-moving events.
You can read more on trading strategies in our article 'Trading strategies. How to adopt the one to suit your goals in 10 minutes?'
Pros and cons of intraday trading
Pros of Intraday Trading
Cons of Intraday Trading
With intraday trading, timing is everything—you need to enter and exit positions quickly and decisively. To do this effectively, it's essential to identify optimal entry and exit points in the market. That's why intraday traders often rely on technical tools like moving averages and candlestick patterns, which help highlight reliable price levels for buying and selling within the same trading day. As in the example below, a trader may use a short-term moving average, such as a 50-day moving average (MA). The 50 MA could act as the intraday trend. If the price is above the 50-day MA, the trend is up. If it is below the 50 MA, the intraday trend is down. Thus, a bounce on the 50 MA is considered an intraday signal. Moreover, for an exit signal, traders use lower MAs, such as the 13 MA. A price close below this MA signifies an exit signal.How to enter and exit positions in intraday trading
Moving average crossover strategy
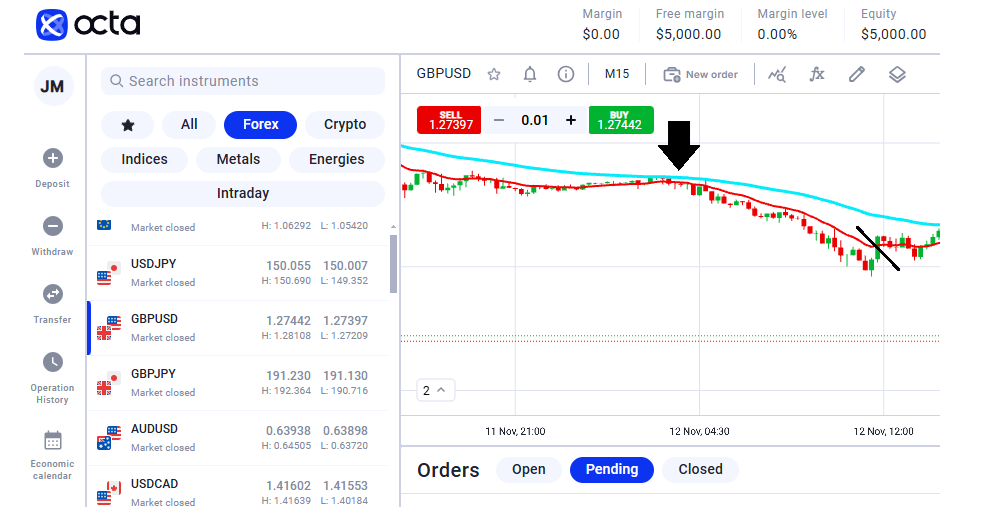
The aqua-coloured MA is the 50-day average, and the red-coloured MA is the 13 MA. Note that a trader may employ another set of MAs that seem appropriate.
Intraday trading strategies would not be complete without a clear understanding of the implications of the candlestick pattern. Recognising candlesticks makes it easy to identify entry and exit positions. Engulfing candle patterns occur whenever the body of one candle engulfs that of the preceding candle. The greater the number of candles in a given pattern, the stronger the trend.Candlestick patterns
Engulfing candle patterns

Bullish engulfing patterns signal an uptrend. They occur whenever a market is moving down, and then suddenly, a bullish candlestick occurs such that its entire body covers the previous sell candle.
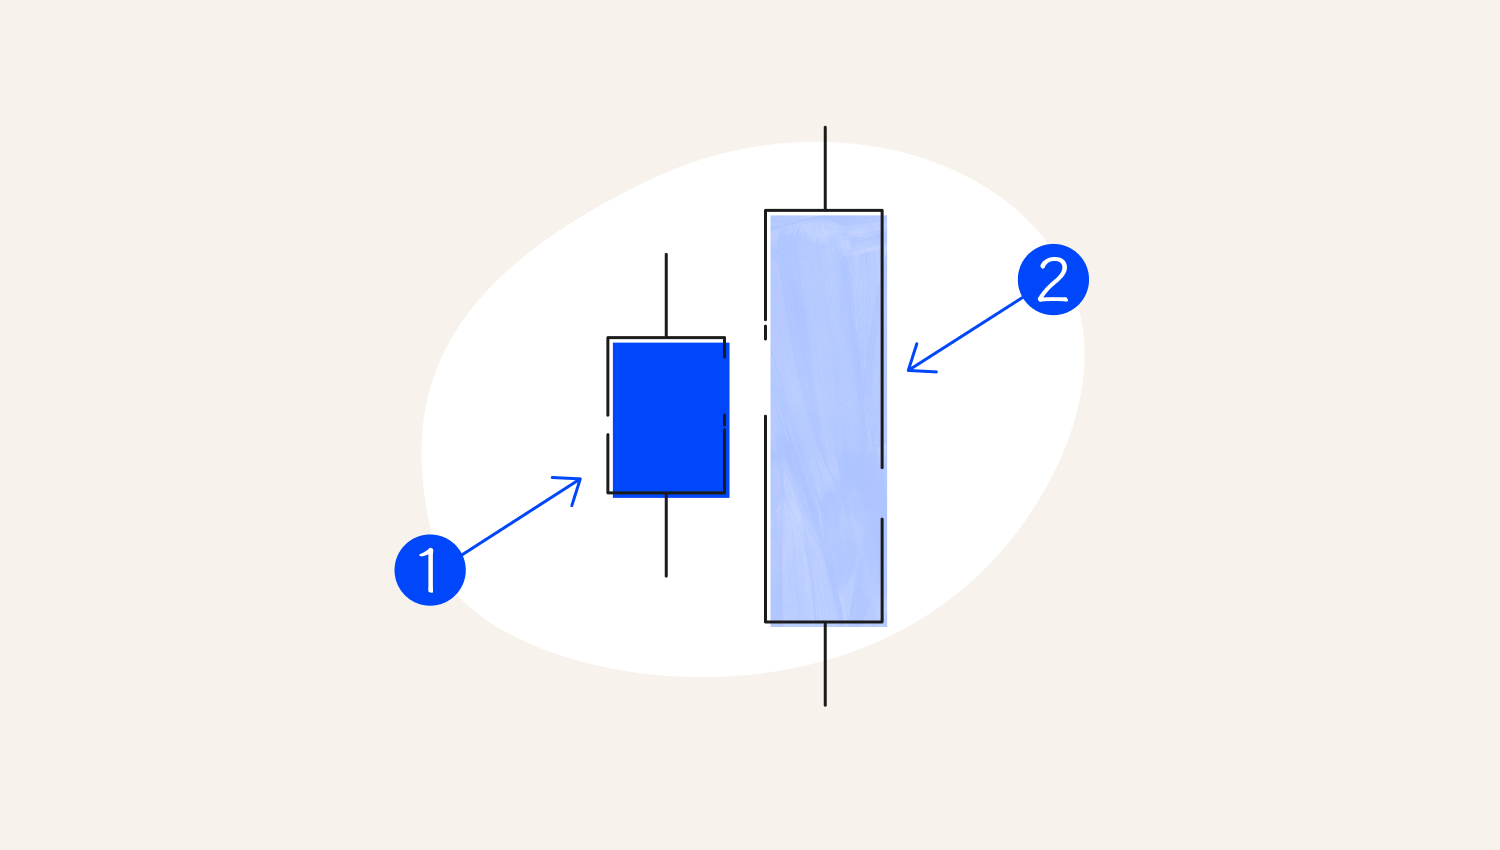
1. Small body
2. The engulfing candle covers the first candle's proper body
A bearish engulfing candle, on the other hand, signifies a sell signal. It occurs whenever a market is moving up, and a strong bearish or sell candle appears, engulfing the previous bullish candle.
1. Bearish Engulfing
Hammer patterns
Hammer pattern signal candles indicate a potential price reversal. They occur whenever the body of a candle sits on one end of a candle. An intraday trader may use them to enter a trade and place a stop loss at the lower or upper end of the candle.
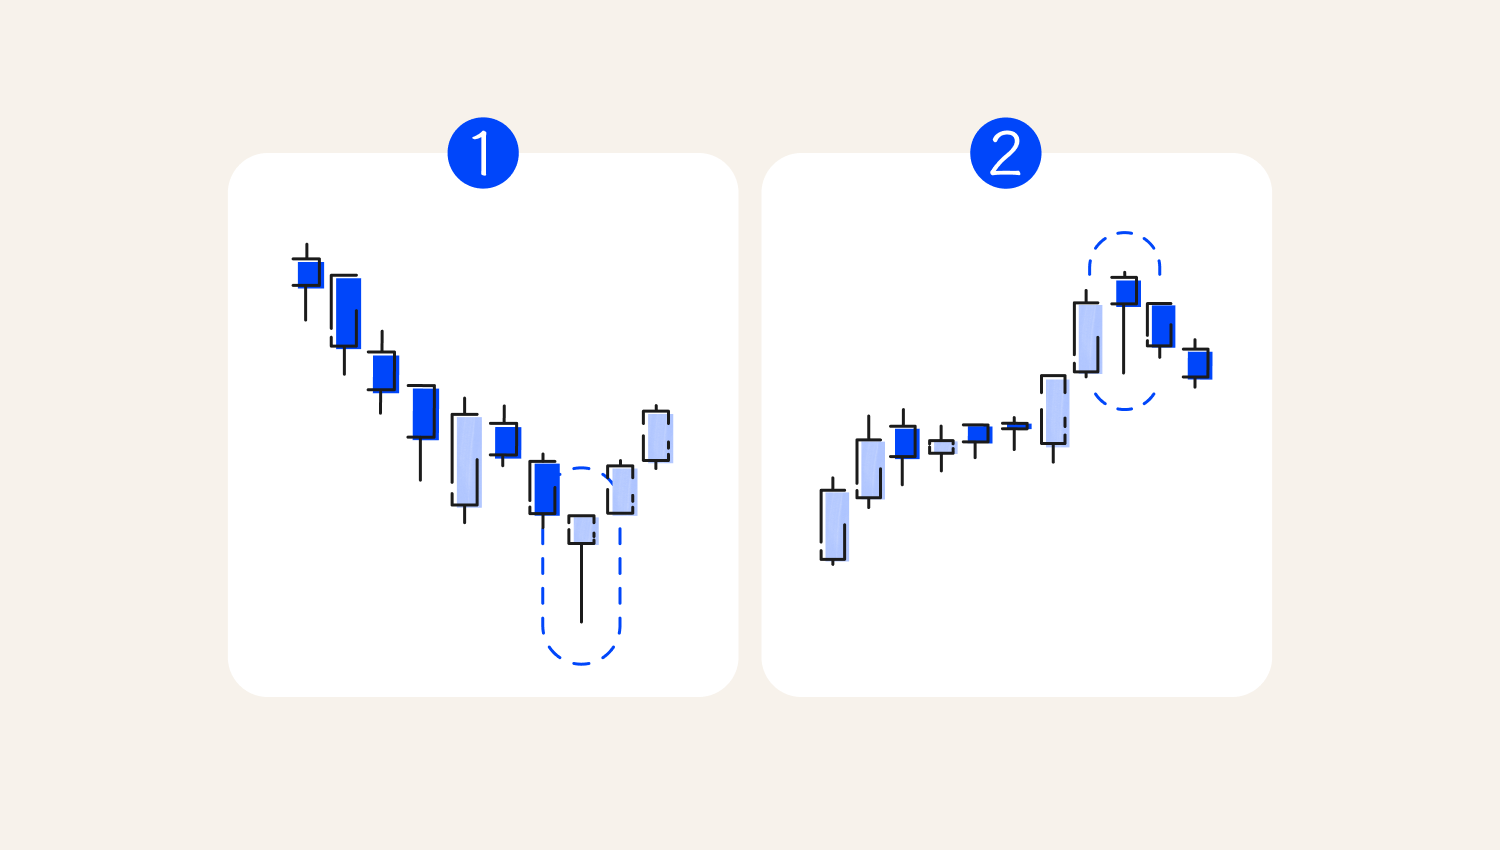
1. Hammer
2. Hanging Man
Intraday trading involves dealing with lower time frames where risks tend to be high. For this reason, traders should be extra cautious when entering positions to minimise losses. Here are some other tips to help you manage risk: If you arm yourself with a solid trading plan, risk strategy, and knowledge base, you will be able to make the most of intraday trading at Octa.Risk management
Final thoughts
